Why Aircraft Are Being Grounded in 2026
A System-Level Analysis of the Structural Pressures Driving Fleet Groundings Across the Global Aviation Industry
The Aircraft Is Parked. The Schedule Has Not Moved.
BUSINESS IMPACT
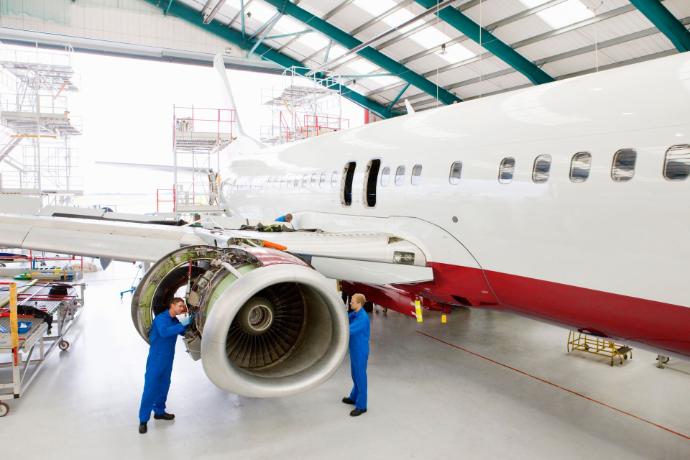
Somewhere in a maintenance bay tonight, an aircraft is sitting idle that was supposed to be in the air. The passengers have been re-booked. The crew has been reassigned. The flight has been cancelled or delayed. And the airline's operations team is calculating how many more days — and how many hundreds of thousands of dollars — stand between that aircraft and its next revenue rotation.
This is 2026 aviation. Not an emergency. Not an anomaly. A pattern.
IATA estimates the post-pandemic maintenance backlog and parts crunch cost the industry approximately $11 billion in 2025 alone. A single narrowbody aircraft grounded for three days generates between $10,000 and $150,000 in direct lost revenue — before AOG logistics, crew disruption, passenger compensation under EU and DOT regulations, and wet-lease costs are added. Wizz Air's engine grounding crisis provides a stark reference point: 41 aircraft taken out of service simultaneously, €300 million in OEM compensation, a €39 million wet-lease bill, and a 21% collapse in operating profit.
A grounded aircraft is not just a maintenance event. It
is a network disruption event — and in 2026, disruption is no longer the
exception.
A grounded aircraft is not just a maintenance event. It is a network disruption event — and in 2026, disruption is no longer the exception.
The consequences do not stop at the aircraft. Grounded jets compress route networks. They force schedule changes that damage slot utilization at constrained airports. They trigger compensation cascades and push airlines toward wet-lease markets at premium rates. For low-cost carriers with tight turnaround models, a single unavailable aircraft is not one missed rotation. It is a full-day schedule collapse across a route family.
The question is no longer whether groundings will happen. It is whether an airline has the operational architecture to contain them — or whether each event becomes a commercial crisis.
The Narrative the Industry Keeps Getting Wrong
INDUSTRY ASSUMPTION
The default explanation for aircraft groundings cycles through familiar talking points: a faulty component, a supply chain hiccup, a temporary post-pandemic hangover. Each framing implies the problem is local, recent, and correctable with the next shipment.
None of them are accurate enough to be useful.
Groundings in 2026 are not isolated technical events recovering from a pandemic disruption. They are the visible output of structural pressures that have been building across engines, MRO infrastructure, supply chains, fleet age profiles, and workforce pipelines — simultaneously, and for years. The maintenance backlog was created before COVID. The workforce shortage predates 2020. The delivery delays that are forcing airlines to retain aging fleets were set in motion by manufacturer production constraints that have yet to resolve.
› The bottleneck is rarely one component. It is the chain around it.
What 2026 has added is convergence. These pressures, which once operated independently enough to be managed separately, now amplify each other. An engine inspection surge creates MRO slot shortages, which extend AOG events, which push airlines to hold ageing aircraft longer, which increases unscheduled maintenance demand, which further strains the same oversubscribed supply chain. The loop closes on itself.
This is not a short-term disruption. It is a structural condition. And the industry's recovery timelines will remain optimistic until that distinction is treated seriously.
The Core Insight: Groundings Are System-Level Events
CENTRAL THESIS
Aircraft groundings have been reframed by many operators as maintenance problems. They are not. They are system-level operational failures — the result of cascading dependencies that no single team, vendor, or intervention can resolve in isolation.
The engine inspection sits in queue because the shop has no capacity. The shop has no capacity because it lost technicians and never replaced them. The part that would allow an early return-to-service doesn't exist in the regional pool because delivery backlogs have starved used serviceable inventory. The replacement aircraft isn't available because the airline is already operating at peak utilization with an older fleet it cannot retire.
› The aircraft is parked long before the AOG declaration is made.
Understanding this chain — engines, MRO capacity, workforce, supply chain, fleet age, delivery timelines, aftermarket responsiveness — is the difference between reactive damage control and structural resilience. The operators managing groundings most effectively are not the ones with the fastest parts delivery. They are the ones who closed the loop between all of these domains before the event.
The Eight Structural Pressure Areas
OPERATIONAL ANALYSIS
The following eight pressure areas are not independent variables. They interact, amplify, and cascade into each other. Each is analyzed from the operator's experience outward.
1 | Engine Reliability & Inspection Pressure
A. What Operators Are Experiencing
Hundreds of aircraft sitting idle waiting for engine shop slots that don't exist. Pratt & Whitney's GTF crisis — triggering an FAA Emergency Airworthiness Directive requiring removal of approximately 700 PW1100G engines — created a grounding wave affecting up to 46% of the A320neo fleet at its peak. At the same time, LEAP engines are now entering first shop visits at scale: roughly 3,700 LEAPs across 150 operators requiring mid-life care, compressing the same capacity that legacy CFM56 and V2500 engines are still consuming.
B. What Is Actually Causing It
The assumption that next-generation turbofans would reduce maintenance burden has proven to be structurally incorrect. High-bypass modern engines combine tighter tolerances, more components, and more complex materials — meaning that when issues emerge, the repair complexity and turnaround time scale accordingly. GTF engine shop visits currently run 300–360 days in a capacity-constrained market. Spare turbofan lease rates have doubled; a mid-life narrowbody engine now leases for $200,000–$350,000 per month.
C. Why the Problem Keeps Escalating
Engine MRO demand is projected to exceed available shop capacity by 15–20% before 2030. That shortfall is not a forecast to manage around — it is a structural condition that will define the grounding rate for the next several years. Every engine that enters shop ahead of schedule due to a defect or regulatory directive pushes another engine further back in the queue.
› Modern engines are not maintenance-free. They are maintenance-intensive in a new way — and the infrastructure has not kept pace.
D. What the Industry Gets Wrong
Treating the GTF crisis as a one-off manufacturing problem misses the deeper issue. Manufacturing defects accelerated an inspection wave, but the underlying demand-capacity imbalance in engine MRO existed before the AD was issued. The defect exposed the fragility of the capacity system, not just the component.
E. What Operational Resilience Actually Requires
Long-horizon spare engine positioning. Power-by-the-hour and guaranteed shop-slot agreements negotiated well in advance of inspection cycles. Removal-rate trend analysis that gives engineering teams visibility into upcoming capacity demand before the queue closes. And the discipline to treat engine availability as a fleet planning variable, not a maintenance variable.
2 | MRO Capacity Bottlenecks
A. What Operators Are Experiencing
Months-long waits for C-check and D-check slots. Any unscheduled airframe, avionics, or structural event cascading into a multi-week AOG because no shop can absorb unplanned work. Turnaround times inflating as shops run at or beyond sustainable throughput. Component repair networks similarly stretched — composite layup capacity, titanium forgings, and specialist repair capabilities are all constrained.
B. What Is Actually Causing It
The pandemic deferred significant scheduled maintenance. The 737 MAX groundings between 2019 and 2023 created additional capacity distortions. Both hit the MRO infrastructure as a bow wave — all at once, into a system already running at high utilization. Regionally, Asian carriers face local capacity gaps despite fleet growth. North American and European shops are handling older fleets with spend outpacing throughput expansion.
C. Why the Problem Keeps Escalating
MRO capacity cannot be created quickly. Building and staffing a maintenance bay takes years. Certifying technicians takes years. The structural mismatch between demand growth and capacity growth will not correct on a 12–18 month horizon regardless of market pricing signals. Higher TAT fees and premium charges have not resolved the slot shortage — they have simply made groundings more expensive.
› Operators now have to plan 'just-in-case.' Extra engines, critical spares on hand, long-term shop agreements. The era of on-demand MRO is over.
D. What the Industry Gets Wrong
Assuming higher prices will attract enough new capacity to close the gap. Price signals are necessary but insufficient when the constraints are physical infrastructure and certified labor — neither of which responds to market pricing in the near term.
E. What Operational Resilience Actually Requires
Multi-year MRO capacity agreements. Proactive scheduling of checks as far in advance as technical planning allows. Strategic relationships with independent MRO providers to access overflow capacity. And realistic forecasting of aircraft utilization that accounts for extended TATs, not pre-pandemic benchmarks.
3 | Supply Chain Instability
A. What Operators Are Experiencing
Parts lead times that have inflated from 4–6 weeks in healthy conditions to 20–40+ weeks for engine MRO components. Minor parts shortages — an avionics box, a landing gear pin, a sensor — grounding aircraft for days when the replacement or repair is not immediately available. Unpredictable spare flow where suppliers are scheduling deliveries just enough to fill orders, leaving no operational buffer.
B. What Is Actually Causing It
OEMs and tier suppliers consolidated aggressively during COVID, reducing the number of sole-sourced production lines for key components. Aerospace-grade titanium remains impacted by sanctions, with normalization projected 2–3 years away. Semiconductor and casting bottlenecks continue to affect both avionics and structural components. And the global delivery backlog — now exceeding 17,000 aircraft with a 12-year wait — has dramatically reduced the supply of used serviceable inventory, because fewer aircraft are retiring.
› Fewer retirements mean less used serviceable inventory. The new-aircraft shortage is simultaneously a parts shortage.
C. Why the Problem Keeps Escalating
Supply chains in aerospace are long. Rebuilding production capacity at tier-one and tier-two suppliers after consolidation takes years. Trade tariffs on metals and electronics add cost and delay to already fragile pipelines. And the combination of high demand, low inventory buffers, and constrained production creates a system with no slack — where any upstream disruption transmits directly to the aircraft.
D. What the Industry Gets Wrong
Treating supply chain as a procurement function rather than an operational risk function. When lead times are 40 weeks, sourcing decisions made today determine availability in the next operational season. Airlines that treat this as a reactive function will consistently be behind the curve.
E. What Operational Resilience Actually Requires
Inventory positioning strategy based on removal rates, not historical reorder points. Rotable pool participation and exchange program access for high-removal components. Supplier diversification for sole-sourced risk items. And supply chain visibility tools that give operations teams real-time sight of critical part locations — before the AOG call is made.
4 | Aging Fleets & OEM Delivery Delays
A. What Operators Are Experiencing
An average global fleet age that has reached approximately 13–15 years — the oldest on record — as airlines retain aircraft they expected to retire years ago. Aircraft flying 2% more annual hours than historical averages. More frequent structural inspections, life-limited parts replacements, corrosion control interventions, and unscheduled defects per aircraft per year. A320ceos and 737NGs still in full commercial service generating the maintenance burden of mature platforms with the availability expectations of modern ones.
B. What Is Actually Causing It
IATA data shows approximately 5,284 deferred aircraft deliveries in the 2019–2026 window. Airlines that planned fleet transitions around those deliveries are now operating legacy equipment indefinitely. The older the aircraft, the higher the maintenance frequency, and the less OEM prioritization its spares and support receive — because OEM commercial attention has shifted to newer technology platforms.
C. Why the Problem Keeps Escalating
Aging aircraft do not generate linear maintenance cost increases. They generate nonlinear defect rates. A jet entering its 15th year of service has a meaningfully higher probability of a C-check squawk per check visit than the same aircraft at year 10. Multiplied across a fleet being retained beyond its planned service life, this creates a demand surge on MRO capacity that compounds every pressure discussed above.
› Retaining older metal longer does not just extend a maintenance schedule. It changes the shape of the demand curve.
D. What the Industry Gets Wrong
Modelling aging fleet cost impact as a straight-line extension of current maintenance expenditure. The nonlinearity of aging aircraft defect rates means the maintenance cost acceleration arrives faster than financial models suggest.
E. What Operational Resilience Actually Requires
Fleet age-stratified reliability analysis. Phase-of-life maintenance strategies that treat a 15-year-old aircraft differently from an 8-year-old aircraft in the same type. Legacy component stocking plans that account for OEM support contraction. And delivery tracking that dynamically adjusts fleet-exit plans as manufacturer commitments shift.
5 | Workforce & Skills Crisis
A. What Operators Are Experiencing
MRO slots that are technically available but operationally unfillable because the technicians to perform the work don't exist in sufficient numbers. AOG events that extend by days not because the technical solution is unclear, but because the licensed mechanics are not available to execute it. Shops unable to schedule additional shifts. Overtime fatigue creating quality risk on top of capacity risk.
B. What Is Actually Causing It
Boeing projects 710,000 new maintenance technicians will be needed globally by 2044. The industry is already carrying a 10% shortage of licensed mechanics. More than 25% of current technicians are over 64. In some regions, more than 40% of senior mechanics are above 60. The training pipeline to replace them takes years, and the pipeline intake is structurally insufficient relative to retirement volumes.
C. Why the Problem Keeps Escalating
The workforce shortage is not recoverable on a short timeline. Aviation maintenance certification takes years. The demographic pipeline is fixed — the technicians who will retire in the next 5–6 years are already identifiable, and most of their replacements are not yet certified. Competitive labor markets further accelerate attrition, as skilled mechanics move to better-compensated adjacent industries.
› A workforce gap converts what might have been a four-hour fix into a four-day delay. That arithmetic compounds across every AOG event in the system.
D. What the Industry Gets Wrong
Treating the workforce crisis as an HR challenge rather than an operational risk. The shortage is already affecting dispatch reliability, AOG duration, and MRO throughput. It needs to be managed as a structural constraint on operational capacity — not a background hiring challenge.
E. What Operational Resilience Actually Requires
Long-term technician pipeline investment: school partnerships, apprenticeship programs, accelerated certification pathways. Workforce retention strategies that recognize compensation competition from adjacent industries. MRO partnership structures that provide access to shared labor pools. And operational planning that accounts for realistic technician availability — not theoretical shop capacity.
6 | AOG Economics & Operational Pressure
A. What Operators Are Experiencing
Direct revenue losses of $10,000–$150,000 per grounded narrowbody per day. Repair and logistics costs on AOG engine events that can exceed $600,000 for a single three-day event. Passenger compensation obligations of up to $700 per passenger under EU and DOT regulations. Wet-lease premiums at rates that eliminate any remaining margin from the affected rotation family. And schedule compression that creates knock-on disruption across the network far beyond the grounded aircraft.
B. What Is Actually Causing It
Speed has become the dominant AOG cost variable. An AOG incident adds 30–50% on top of normal maintenance costs due to time pressure alone — premium shipping, courier networks, expedited labor, and emergency shop prioritization. Airlines now routinely pay significantly more for a faster resolution than the repair itself would cost in a planned context. Urgency is no longer the exception; it is the baseline.
The aircraft is parked. Every hour is a commercial decision, not just a technical one.
C. Why the Problem Keeps Escalating
As fleets age and MRO slots become scarcer, the frequency of unscheduled events increases while the time available to resolve them decreases. Airlines operating at peak utilization have no schedule slack to absorb even one aircraft's unplanned absence. The result is that each grounding event carries higher commercial stakes than it did five years ago — because the network has less capacity to absorb it.
D. What the Industry Gets Wrong
Calculating AOG cost only from the moment the maintenance declaration is made. By then, the commercial damage is already in motion. The real cost accumulation begins the moment a defect is first identified — and accelerates through every hour of diagnostic delay, parts sourcing delay, and shop queue wait.
E. What Operational Resilience Actually Requires
Pre-positioned inventory for the highest-removal, highest-delay-risk components. 24/7 AOG response capability with supply chain visibility that doesn't start from scratch at the moment of grounding. And a decision framework that authorizes spending on faster solutions before the commercial cost of delay exceeds the premium for speed.
7 | Digital Transformation & Predictive Maintenance
A. What Operators Are Experiencing
Great stories have a personality. Consider telling a great story that provides personality. Writing a story with personality for potential clients will assist with making a relationship connection. This shows up in small quirks like word choices or phrases. Write from your point of view, not from someone else's experience.
Great stories are for everyone even when only written for just one person. If you try to write with a wide, general audience in mind, your story will sound fake and lack emotion. No one will be interested. Write for one person. If it’s genuine for the one, it’s genuine for the rest.
B. What Is Actually Causing It
The gap between what digital tools can theoretically detect and what they currently deliver in production environments remains significant. Data silos across different aircraft types, maintenance systems, and supplier networks reduce the fidelity of predictive models. Some airlines report that predictive maintenance investments in trials have not translated into reliable production-grade outcomes across all failure modes.
› Predictive maintenance earns its value not when it catches a dramatic failure, but when it prevents the third unscheduled removal that would have become a week-long AOG.
C. Why the Problem Keeps Escalating
Digitization cannot create inventory, certify technicians, or manufacture MRO shop slots. Technology that improves fault detection still requires the supply chain and workforce to execute the resolution. Airlines that over-invest in predictive tools while under-investing in supply chain positioning and MRO relationships are trading one vulnerability for another.
D. What the Industry Gets Wrong
Positioning digital transformation as a solution to the grounding crisis rather than an enabler of better management within it. AI and analytics improve planning and throughput when grounded in operational reality — they do not eliminate the structural shortages they are helping to navigate.
E. What Operational Resilience Actually Requires
Digital investment that is tightly connected to supply chain action: fault detection triggering inventory positioning, not just engineering alerts. Standardized data environments that allow predictive models to operate across fleets rather than being rebuilt for each aircraft type. And realistic expectations — measured against actual unscheduled removal reduction, not platform adoption rates.
8 | The Strategic Rise of the Aftermarket Ecosystem
A. What Operators Are Experiencing
Airlines are no longer treating aftermarket providers as parts suppliers. They are structuring relationships as operational continuity partners — with forward-positioned inventory, 24/7 AOG response teams, rotable exchange programs, and integrated repair-and-return capabilities. The speed at which an aftermarket partner responds to an unscheduled event is now a direct variable in fleet availability calculations.
B. What Is Actually Causing It
When OEM support channels are constrained by delivery backlogs and shop capacity, independent aftermarket providers become the effective resolution path. Operators that have pre-established relationships with independent MRO and supply networks are accessing parts and repair slots that are simply not available through traditional OEM channels.
C. Why the Problem Keeps Escalating
The aftermarket's strategic importance will continue to increase as new aircraft deliveries remain delayed and legacy fleets remain in service beyond planned service lives. The pool of used serviceable inventory — which the aftermarket largely manages — becomes relatively more valuable as OEM new-part lead times extend.
› Aftermarket responsiveness is not a procurement metric. It is a fleet availability metric.
D. What the Industry Gets Wrong
Treating aftermarket relationships as transactional vendor arrangements rather than strategic operational partnerships. An aftermarket provider without pre-positioned inventory, real-time visibility, and AOG response capability is still a transactional vendor — regardless of the contract structure.
E. What Operational Resilience Actually Requires
Aftermarket partner selection criteria that include inventory positioning, AOG response capability, repair turnaround benchmarks, and supply chain visibility — not only unit pricing. And the organizational recognition that aftermarket performance belongs in operations and engineering discussions, not only procurement reviews.
What the Industry Consistently Gets Wrong
BELIEF VS. REALITY
The assumptions that shape operational decisions today determine tomorrow's grounding rate. The following beliefs are widely held. None of them survive contact with operational data.
|
INDUSTRY BELIEF |
OPERATIONAL REALITY |
|
Groundings are temporary post-pandemic disruptions. |
They are the output of structural pressures that predate COVID: workforce demographics, supply chain consolidation, and fleet age inflation that have been compounding for a decade. |
|
Next-generation aircraft reduce the maintenance burden. |
Modern high-bypass turbofans require earlier and more frequent attention, with higher repair complexity. The GTF crisis proved that new technology introduces new failure modes, not lower maintenance intensity. |
|
The problem is only engine-related. |
Engines generate the largest individual impact, but hydraulic, avionics, structural, and landing gear systems are all under simultaneous pressure from aging fleets and constrained supply chains. |
|
Software and AI will resolve the grounding crisis. |
Predictive tools improve planning. They cannot manufacture MRO capacity, certify technicians, or create inventory. Technology applied to a structural shortage manages the shortage more intelligently — it does not eliminate it. |
|
A parked aircraft is a maintenance problem. |
It is a network disruption problem. The commercial impact — re-bookings, wet-lease costs, crew reassignments, passenger compensation, slot loss — begins the moment the aircraft stops flying, not when the repair order is issued. |
|
Repair turnaround is a procurement concern. |
It is a fleet availability concern. An aftermarket partner's AOG response speed is now a direct input to an airline's dispatch reliability — as significant as any engineering decision. |
Operational Resilience Framework
SIX GOVERNING PRINCIPLES
The operators managing groundings most effectively in 2026 are not reacting faster. They are structured differently. The following six principles reflect what operational resilience requires in a system where every pressure area is active simultaneously.
1 | Capacity-Aware Maintenance Planning
Maintenance scheduling must account for current MRO capacity reality — not historical TAT benchmarks. Airlines that plan check cycles against pre-2020 turnaround norms are consistently surprised by delays their planning models never anticipated. Capacity-aware planning treats shop availability as a planning constraint, not a vendor delivery variable.
2 | Predictive Reliability Intelligence
Fault detection connected to supply chain action. When a predictive model identifies a likely removal event 30 days out, the response must include inventory positioning — not just an engineering alert. The value of predictive tools is realized only when they are integrated with the logistics chain that resolves the fault.
3 | Supply Chain Visibility & Inventory Positioning
For high-removal, high-delay-risk components, inventory position must be managed proactively against removal rate forecasts — not against historical reorder triggers. Real-time visibility across global supply networks is no longer a competitive advantage. It is the baseline operational requirement for a fleet operating in a 40-week lead-time environment.
4 | Rotable & Spare Engine Strategy
Rotable pool participation and spare engine positioning are now fleet planning inputs, not afterthought provisions. Airlines with access to exchange programs on dispatch-critical components consistently convert unscheduled events into manageable maintenance activities. Airlines without that access consistently convert them into AOG crises.
5 | Workforce Sustainability Planning
Technician availability must enter operational planning as a constrained resource, not an assumed input. Long-term maintenance training pipelines, MRO partnership structures that provide access to shared labor capacity, and operational planning models that reflect realistic workforce availability — not theoretical shop headcount — are the foundation of a workforce-resilient operation.
6 | Aftermarket Responsiveness Integration
Aftermarket partner capability must be evaluated as an operational variable: inventory positioning, AOG response time, repair TAT benchmarks, and supply chain visibility — not unit pricing alone. The aftermarket is not a fallback when OEM channels are slow. It is a primary resilience layer that must be actively managed and structured in advance of events.
The Aftermarket Layer: The Most Underestimated Variable
CRITICAL DIMENSION
The aviation industry has spent decades building sophisticated engineering programs, digital platforms, and maintenance frameworks. It has consistently underinvested in the dimension that now determines whether those programs translate into fleet availability: aftermarket responsiveness.
The relationship between parts availability, repair turnaround time, and operational outcome is not linear. A component that could have been exchanged in 24 hours through a well-positioned rotable pool creates a one-day event. The same component sourced from scratch through an extended supply chain creates a seven-day event. The technical repair is identical. The operational outcome is radically different.
30–50% additional cost added to a maintenance event under AOG time pressure — before any commercial disruption cost is counted
This cost differential makes aftermarket positioning one of the highest-return operational investments an airline can make. Rotable pool access, pre-positioned inventory at key operating stations, and 24/7 AOG exchange capability do not just reduce repair cost. They protect the commercial value of the schedule — the most perishable asset in airline operations.
The shortage is no longer inventory alone. It is repair capacity, labor, and time — and the aftermarket is where all three intersect.
The leading aftermarket providers in 2026 are operating as integrated logistics and repair partners, not component vendors. Airlines are increasingly seeking single-partner solutions: one relationship that supplies the spare, manages the repair, provides logistics visibility, and handles the return-to-service documentation. The simplification is not convenience. It is risk reduction — fewer handoffs, fewer delays, fewer opportunities for the chain to break.
And as delivery backlogs keep older aircraft in service longer, used serviceable inventory — the aftermarket's primary stock-in-trade — becomes progressively more valuable. The newer aircraft that would have created this inventory through retirements are not retiring. The USI pool is not replenishing. The aftermarket providers who managed that inventory strategically will hold a structural advantage for the next five to eight years.
Repair turnaround time is now a fleet availability metric. Airlines that do not manage it with the same discipline they apply to technical reliability will consistently see the gap between their maintenance plan and their dispatch reality widen.
Where GFA Fits in the Resilience Architecture
PARTNER PERSPECTIVE
The pressures described in this article do not yield to any single solution. They require coordinated responses across engineering, operations, supply chain, and aftermarket support — executed simultaneously, not sequentially.
GFA operates at the intersection of technical reliability and operational continuity. As an aviation aftermarket specialist with a focus on avionics and aircraft components, GFA's role is to ensure that when engineering analysis identifies a required intervention, the supply chain response matches the operational urgency.
That means forward-positioned inventory on high-removal components. Exchange capability on dispatch-critical units. Repair relationships managed for TAT performance, not just unit cost. Configuration traceability — part number, modification standard, software version — that prevents a replacement from creating a new compliance problem at the moment of installation.
In a grounding environment where the difference between a 24-hour event and a seven-day AOG is often determined by supply chain readiness rather than technical complexity, GFA provides the bridge between what engineering requires and what operations can afford to wait for.
Not a vendor. An operational continuity partner — positioned to respond before the AOG call, not after.
Reliability Is No Longer Only an Engineering Metric
STRATEGIC PERSPECTIVE
The aviation industry has built exceptional engineering capability. It has developed sophisticated maintenance programs, rigorous certification standards, and increasingly powerful diagnostic tools. In 2026, those capabilities are necessary but no longer sufficient.
Aircraft are being grounded not because engineering programs have failed, but because the system surrounding those programs — supply chains, workforce pipelines, MRO infrastructure, aftermarket responsiveness — is operating under structural pressure that engineering alone cannot absorb.
The operators navigating this environment effectively are not doing so through technical excellence alone. They are doing so through systems thinking: connecting maintenance planning to supply chain positioning, workforce availability to shop capacity, engine reliability cycles to aftermarket partner capability. They are treating operational resilience as a cross-functional discipline, not an engineering output.
Groundings in 2026 are structural. The recovery will be too — long, connected, and dependent on decisions made across every dimension of the operation simultaneously.
The organizations that recover fastest will be those that stopped waiting for the system to return to a pre-2020 equilibrium and started designing operations for the system as it actually exists: constrained MRO capacity, 40-week parts lead times, aging fleets, a workforce in demographic transition, and an aftermarket ecosystem that has become a primary resilience layer rather than a fallback option.
Reliability is no longer an aircraft metric. It is an organizational metric — measured not in dispatch reliability alone, but in the resilience of every system that determines whether a grounded aircraft returns to service in hours or weeks.
That is the standard 2026 requires. And the gap between operators who have built to it and those who haven't is widening every quarter.


